logo1PUMPSENSE FLUID ENGINEERING PVT LTD

QAP FOR PERFORMANCE TEST
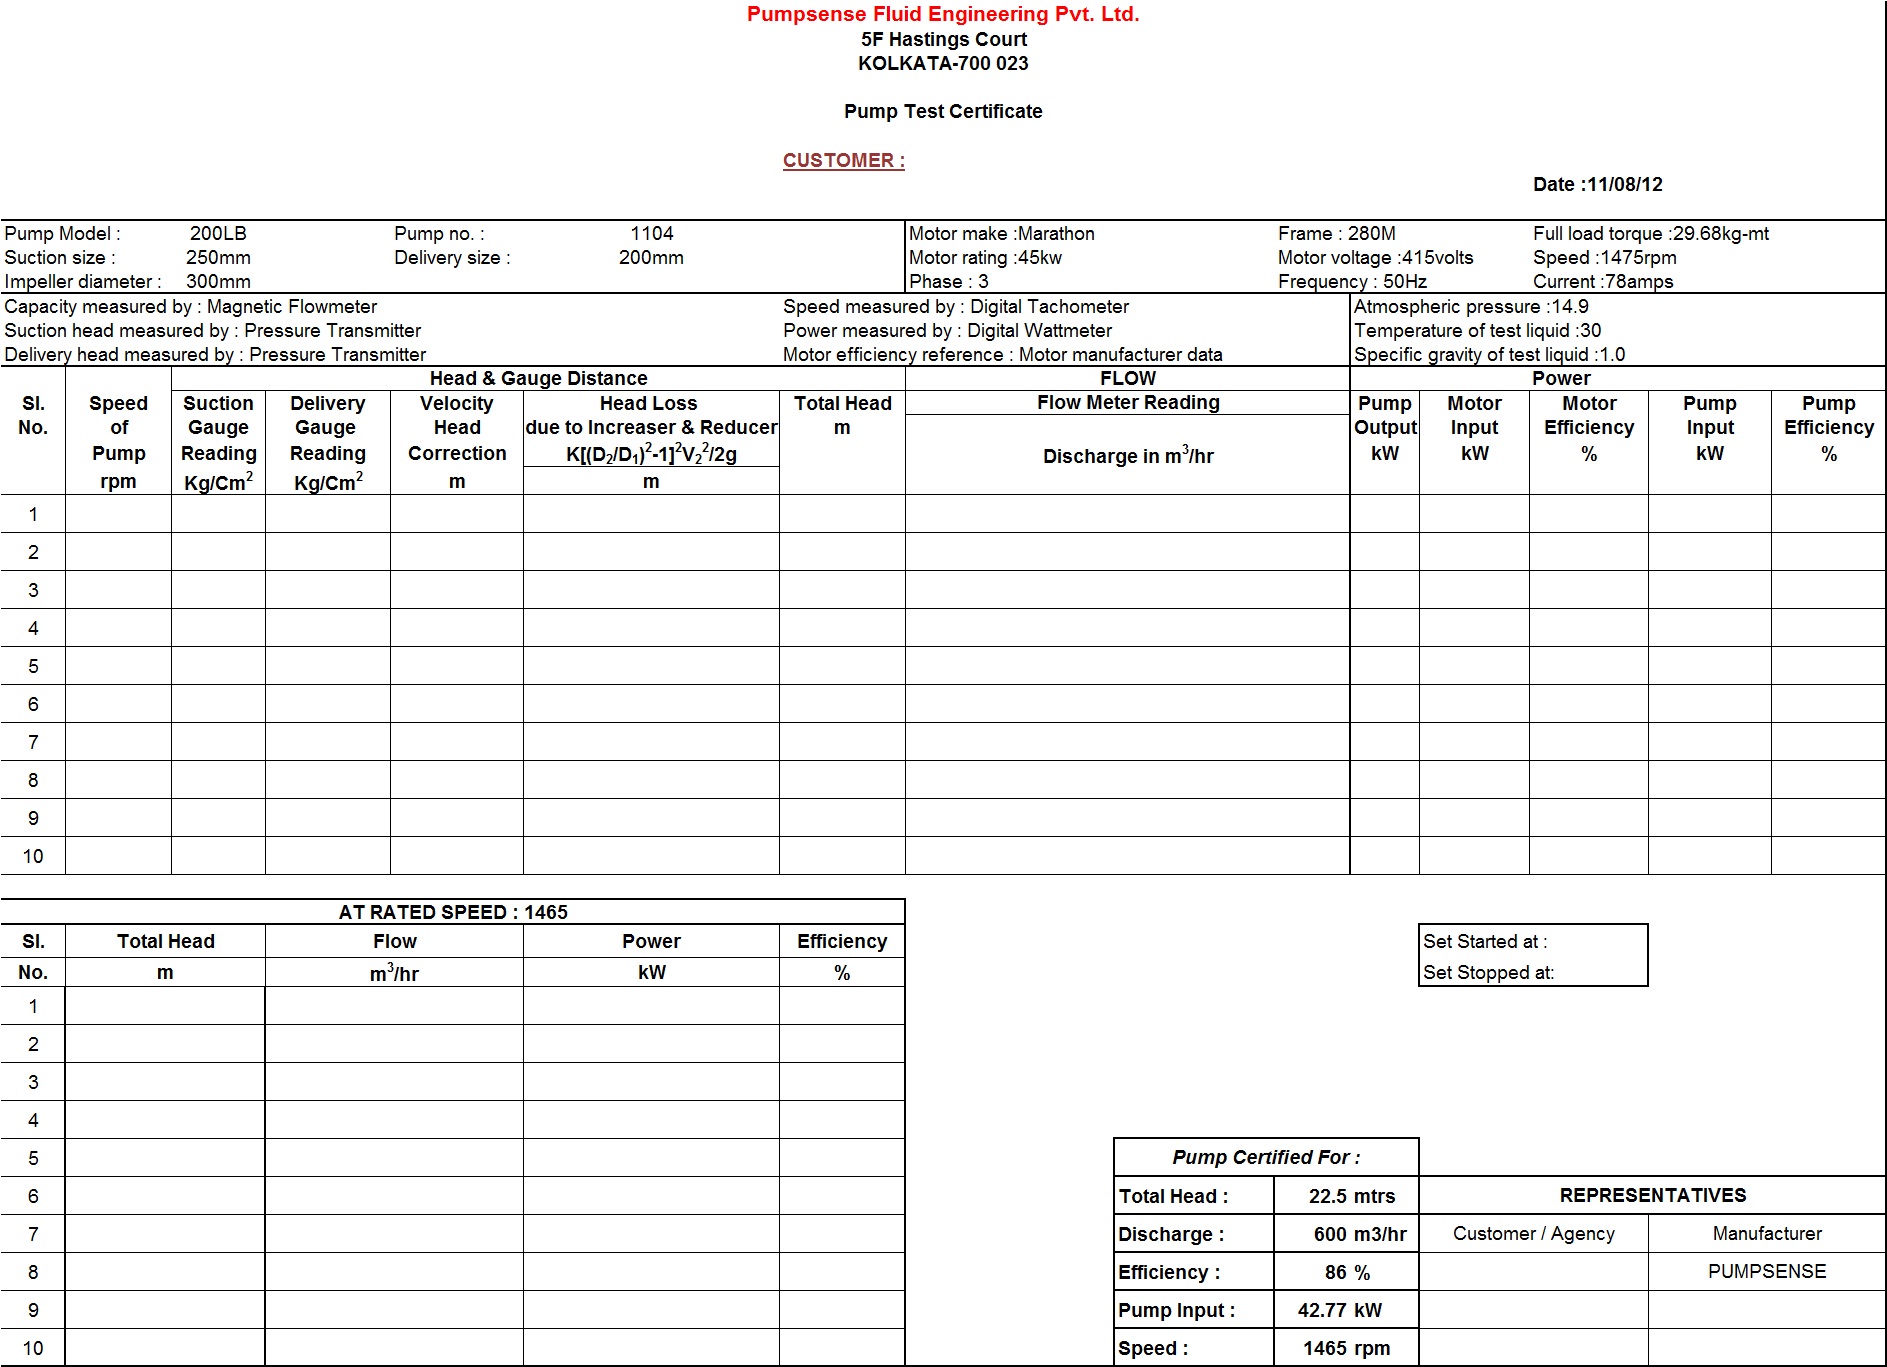
2


7. Test Report


test

After scrutiny, the test results shall be summarized in a report. The report shall consist of the following documents
  1. Test Sheet: A sample test sheet is attached as annexure 2. The test sheet contains information pertaining to pump tested: serial number, type, year of manufacture, etc. in addition to the test data.
  2. Test Curve: Test results are plotted in test curves containing the following: Head vs Capacity, Power vs Capacity, and Efficiency vs Capacity.
  3. Sketch of the test arrangement: This will also include diameters and locations of the measuring sections.
  4. List of measuring apparatus used with their identification numbers and calibration data.
  5. Evaluation and analysis of test results.
Conclusions: This will include recommendations or any corrective measures needed
 
 
8. Test Layout
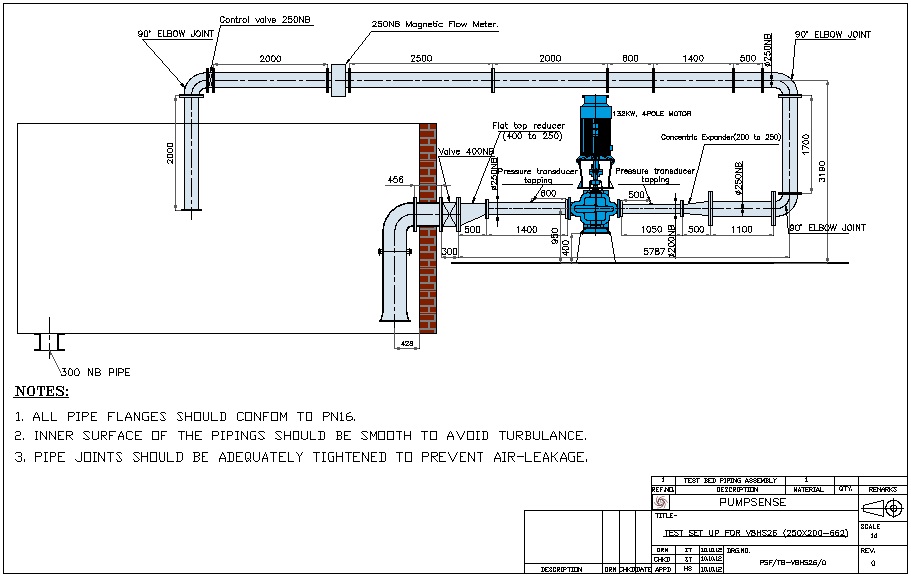
The test arrangement is made in such a way that conditions necessary to fulfill the requirements of the governing standard (ISO 9906) is fully met. It is recognized that the  best measuring conditions are achieved when, in the measuring section, the flow has :
  1. An axially symmetric flow distribution.
  2. An uniform static pressure distribution
  3. Freedom from swirl induced by the installation.

In addition, so far as flow measurement is concerned, it is necessary to ensure that the pipe runs completely full at the measuring sections. Straight lengths provided upstream and downstream of the pressure taps and flow meters shall conform to the requirements of the governing standard.

 A sketch showing the test lay-out

 
Continue.....